
Our work
Work judged by what it does for the business.
Since 2011 we have built more than 70 websites and run search, content and digital programmes for financial services, education, technology and more. Here is who we have worked with, and how we work.
2011working with SA businesses
70+websites built
17clients and ventures shown
0ranking guarantees
Selected clients and group ventures

The Caban Group
Corporate finance and investment group

Caban Corporate Advisors
Corporate finance advisory

LEFA Asset Managers Africa
Africa-focused asset management

Global Executive Business School
Executive education for African leaders

CoinMena Investment Holding

TBL Accounting
Accounting and bookkeeping practice

Broker’s Broker

Digital Foundry
AI consultancy for enterprises

PALM Scientific

Cloud7

Universal Lectures

Homely Wardrobes

Zootom VR

Tapcrunch

Bonus Brick & Paving
Paving contractor, Gauteng

Dunn To Perfection Foundation

Author Deanna Lynn
Several of these are Caban group ventures. Per-client service details are published once approved.
Creative approach
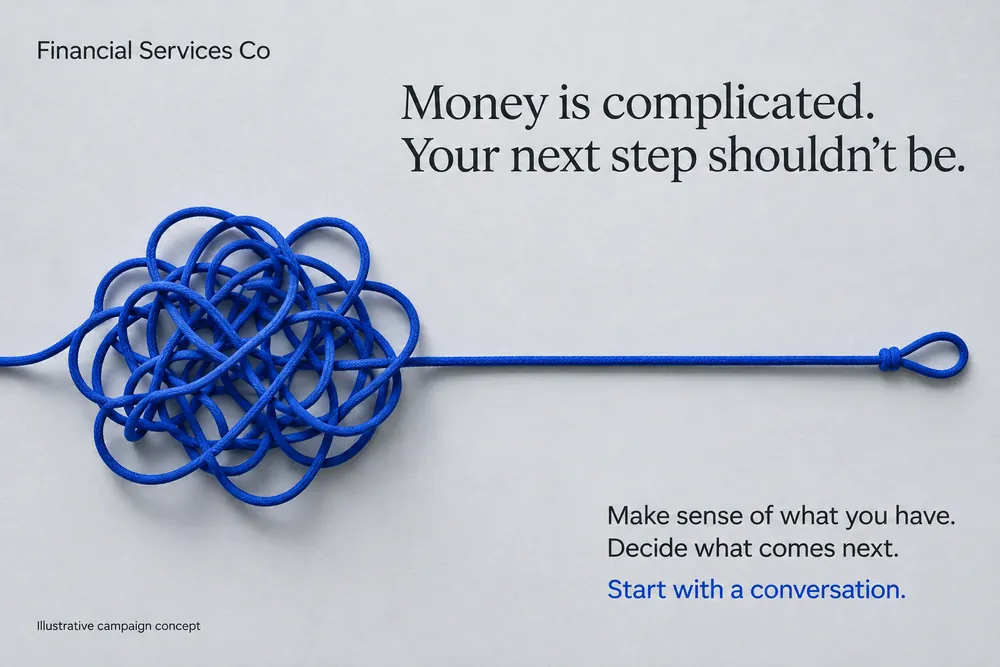
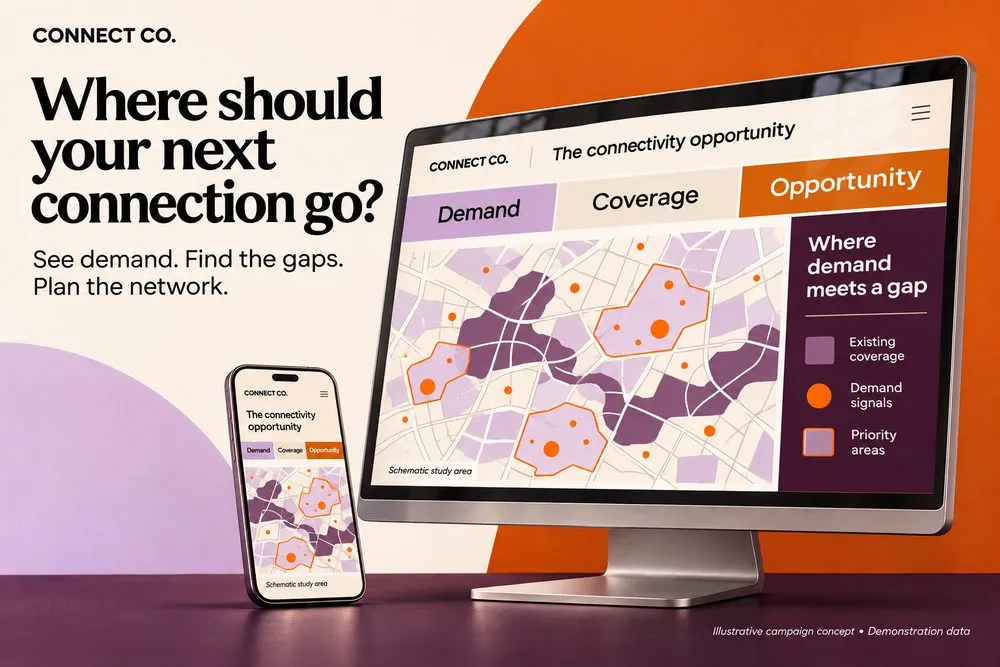
Campaign concepts
Illustrative concepts that show how we think about a message, an audience and a channel. They are not client work, and every brand shown is fictional.
Brand and product campaigns












Data, research and insight
Turning information into decisions: how we frame data collection, integration, analysis and storytelling.




Case study
Content marketing for a venture capital advisory firm
Unlock the power of content marketing for venture capital advisory firm with our partnership success story with Caban Group. Discover how our strategic techniques and thought leadership content propelled Caban Group's online presence, generating backlinks and…
Read the case study →More case studies follow as outcomes are documented and approved by clients.
Data storytelling
Data, told as decisions
Three real data stories from our own site and group ventures, and six samples of the method. Each shows the chart, the number that matters and the decision it supports.
-
Real data · our own site
Search performance
What twelve months of our own search data told us
−82%monthly search impressions, Nov 2025 to Oct 2026
See the full story -
Real data · published by Caban
Market intelligence
Four trackers, four totals: African growth-capital data as a decision brief
24%spread between four credible trackers on the same half-year
See the full story -
Real data · published by TBL Accounting
Tax and cash decisions
From tax notices to dated decisions: the Cash & Tax Brief
1% → 10%late interim EMP501 penalty, rising 1% of annual PAYE a month
See the full story -
Real data sample
Audiences
Which languages do South Africans speak at home?
40.7%isiZulu and isiXhosa together. English: 8.7%. Stats SA data.
See the full story -
Method sample
Customer segmentation
What could 6 behavioural segments look like for a national retailer?
6 segmentsby purchase frequency and basket value, sized by customers
Synthetic data for illustration. Not a client result.
See the full story -
Method sample
Attribution
How would an attribution review change a budget split?
Last-click vs creditedemail, WhatsApp and in-store media given their share
Synthetic data for illustration. Not a client result.
See the full story -
Method sample
Churn and retention
Where do customers leave, and which groups leave first?
3 curvessteep early curves point to onboarding or price problems
Synthetic data for illustration. Not a client result.
See the full story -
Method sample
Loyalty and cross-sell
Which loyalty members are ready for which category?
Propensity mapdark cells show where a personalised offer is most likely to fit
Synthetic data for illustration. Not a client result.
See the full story -
Method sample
Customer lifetime value
How concentrated is customer value?
Value curvethe steeper it rises, the more a few customers matter
Synthetic data for illustration. Not a client result.
See the full story
Websites we have built
A selection of live websites
Home pages of sites we designed and built for group ventures and clients. They are live today and keep changing, so they may differ from how we delivered them.
-
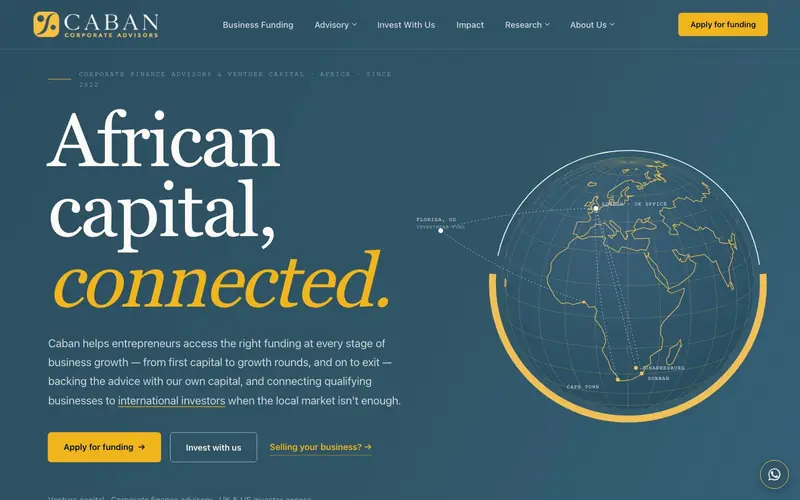 Caban Corporate Advisors caban.co.za
-
 The Caban Group thecabangroup.co.za
-
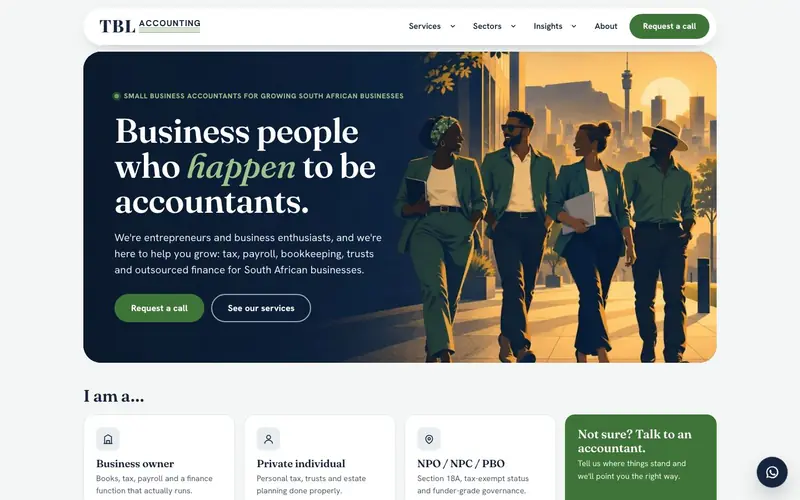 TBL Accounting tblaccounting.co.za
-
 Global Executive Business School gebseducation.co.za
-
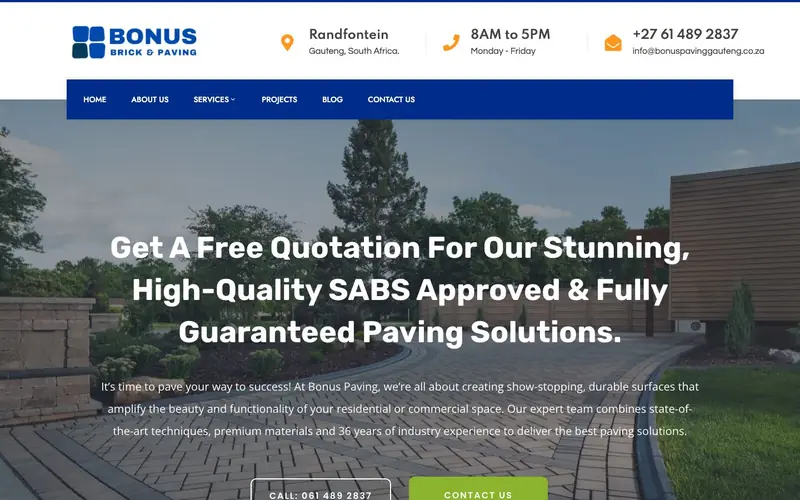 Bonus Brick & Paving bonuspavinggauteng.co.za
-
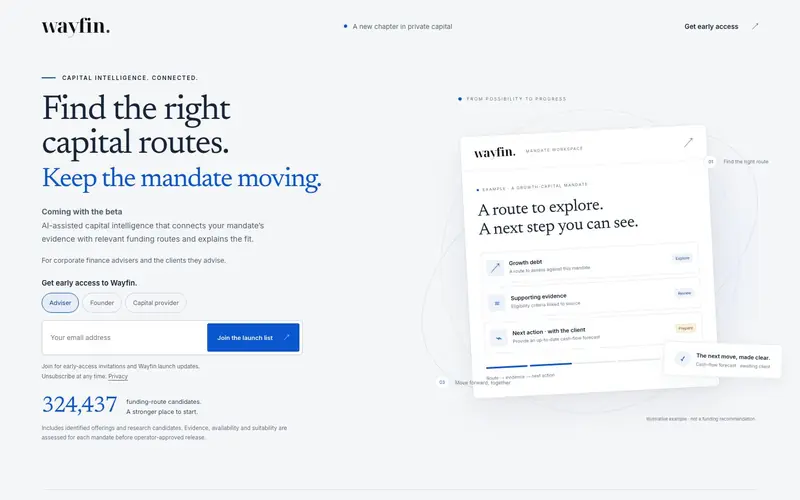 Wayfin wayfin.co
-
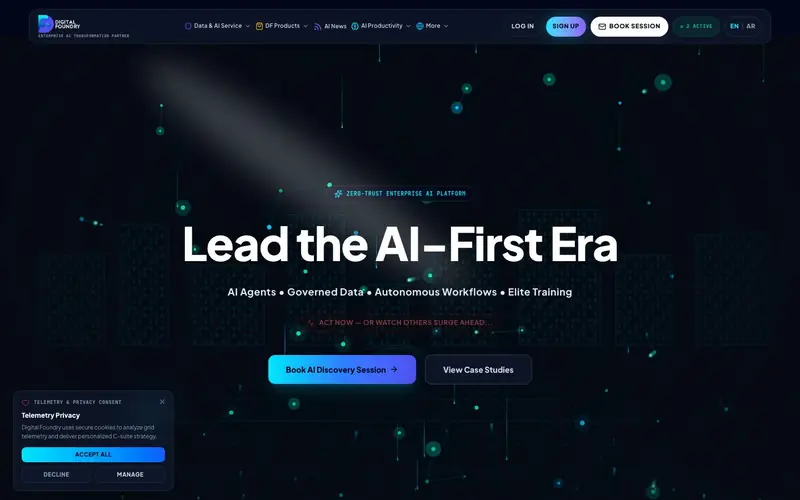 Digital Foundry digitalfoundry.ai
-
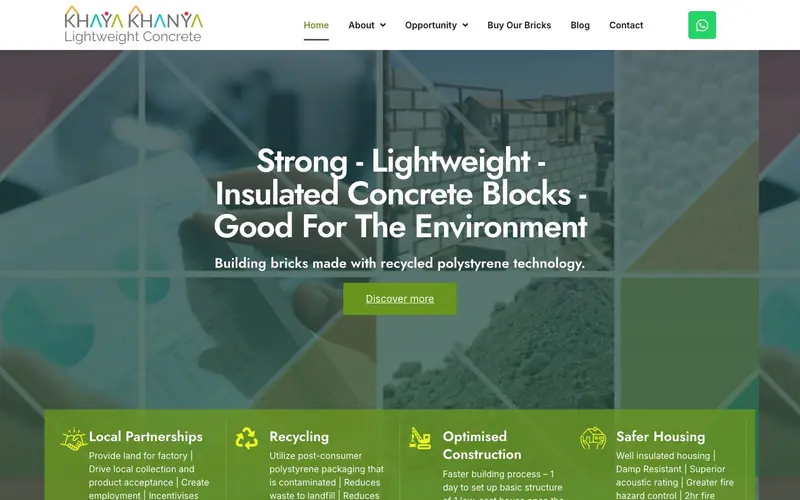 Khaya Khanya khayakhanya.co.za
-
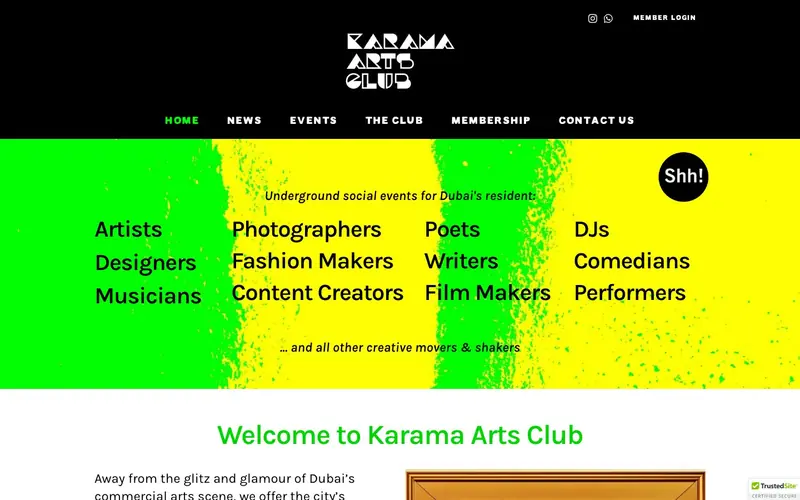 Karama Arts Club karamaartsclub.com
-
 Homely Wardrobes homelywardrobes.co.uk
-
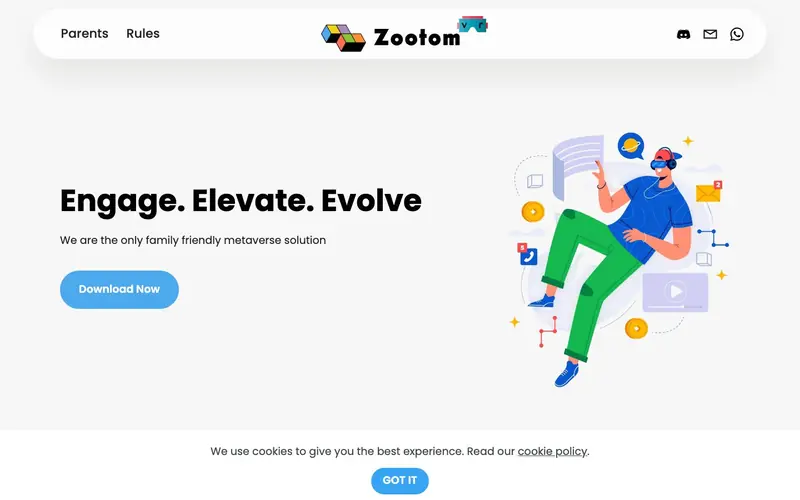 Zootom VR zootomvr.com
-
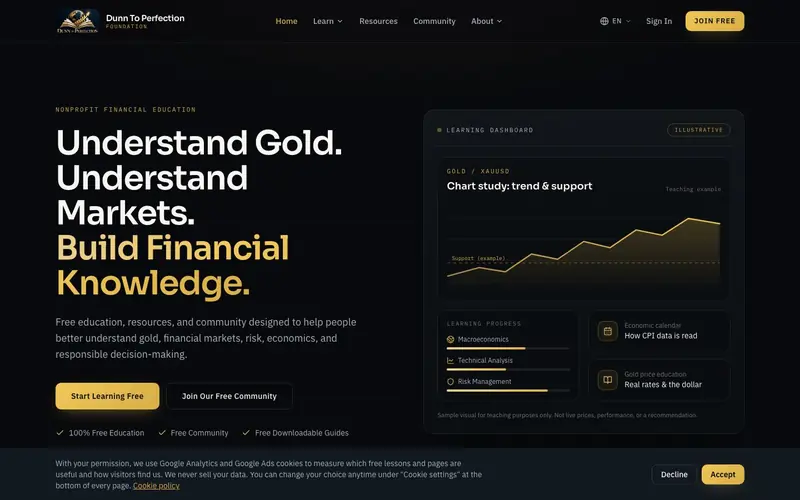 Dunn To Perfection Foundation dunntoperfectionfoundation.org
-
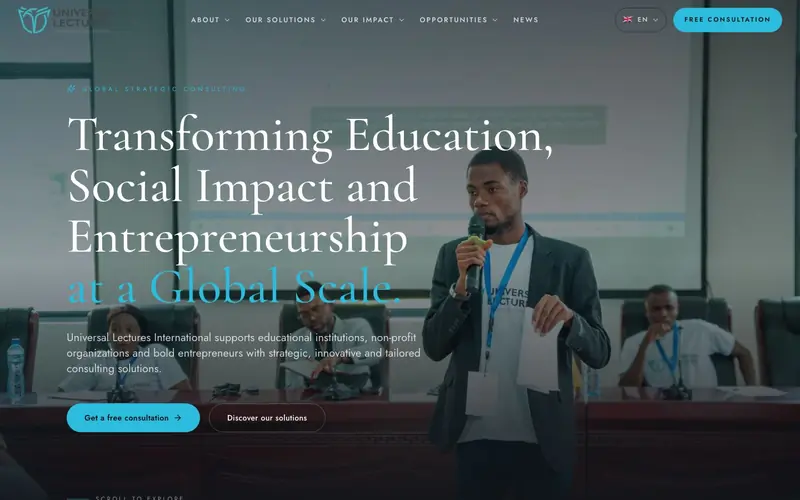 Universal Lectures International universallectures.com
-
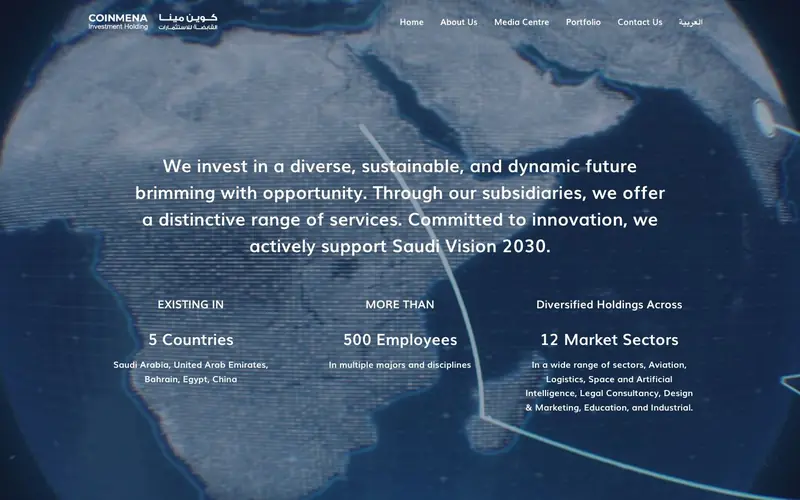 CoinMENA coinmena.com.sa
-
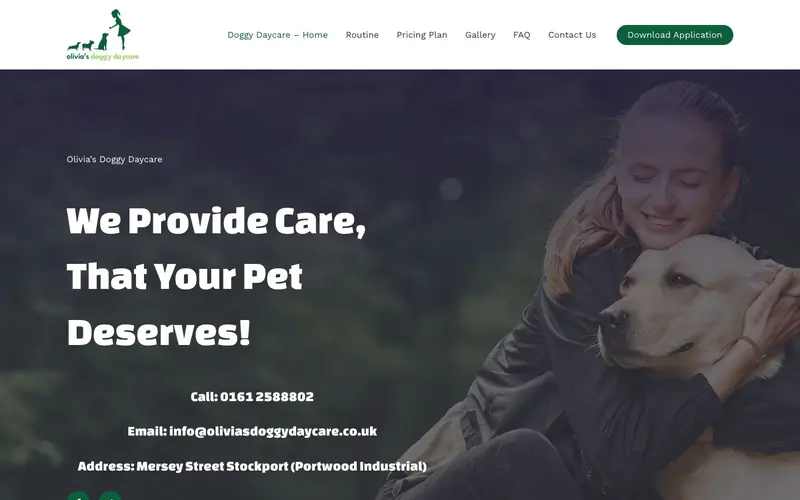 Olivia's Doggy Daycare oliviasdoggydaycare.co.uk
-
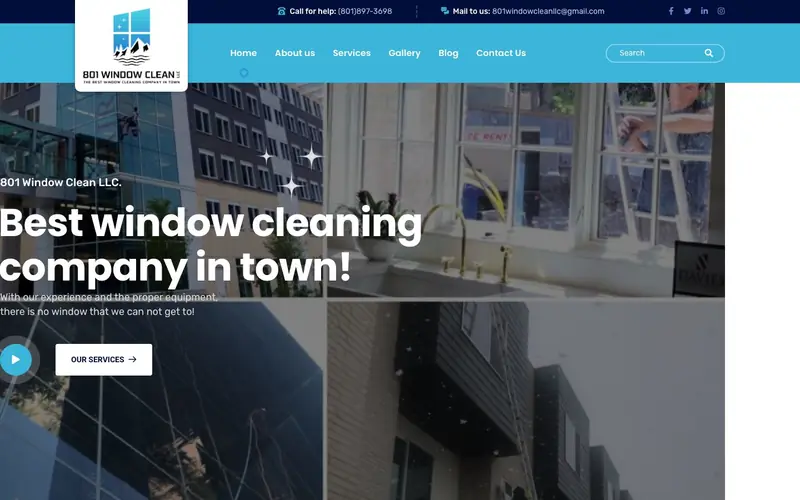 801 Window Clean 801windowclean.com
-
 Diamond X-Ray Lens x-raylens.com
-
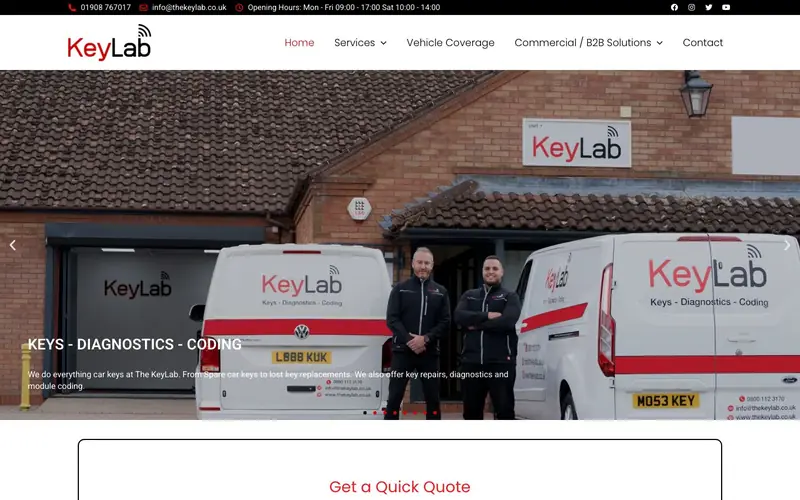 The KeyLab thekeylab.co.uk
-
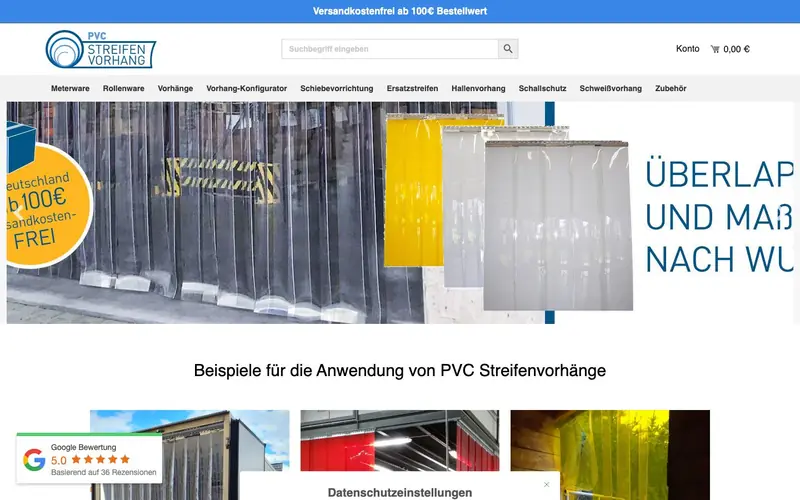 PVC Streifenvorhang pvcstreifen-vorhang.de
-
 Cloud 7 Diagnostics cloud7diagnostics.com
-
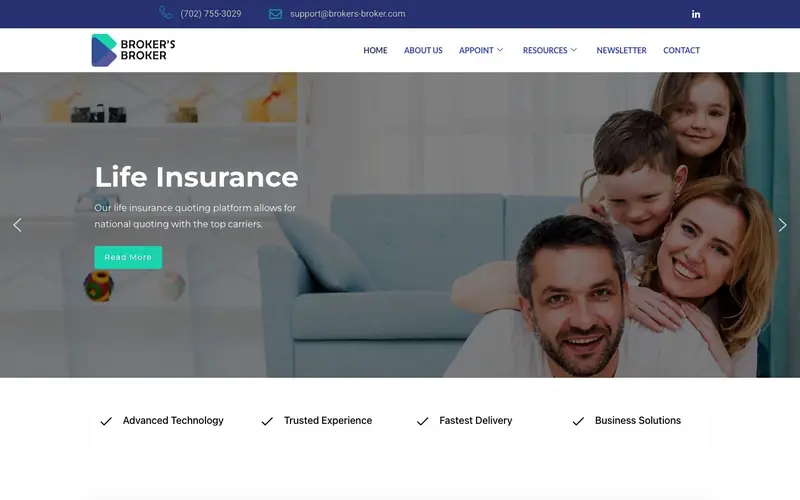 Broker's Broker brokersbroker.com
-
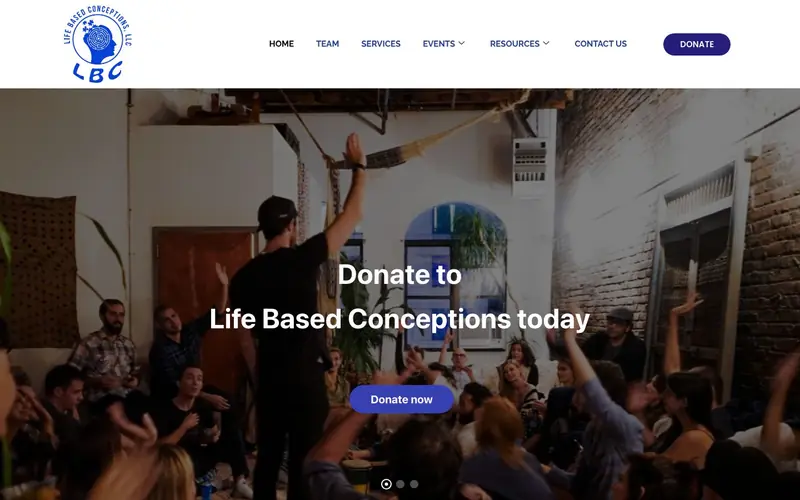 Life Based Conceptions lifebasedconceptions.com
-
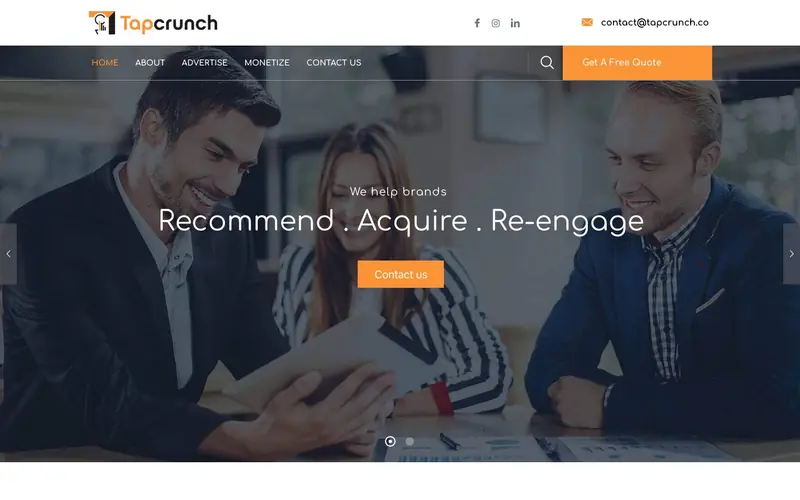 TapCrunch tapcrunch.co
-
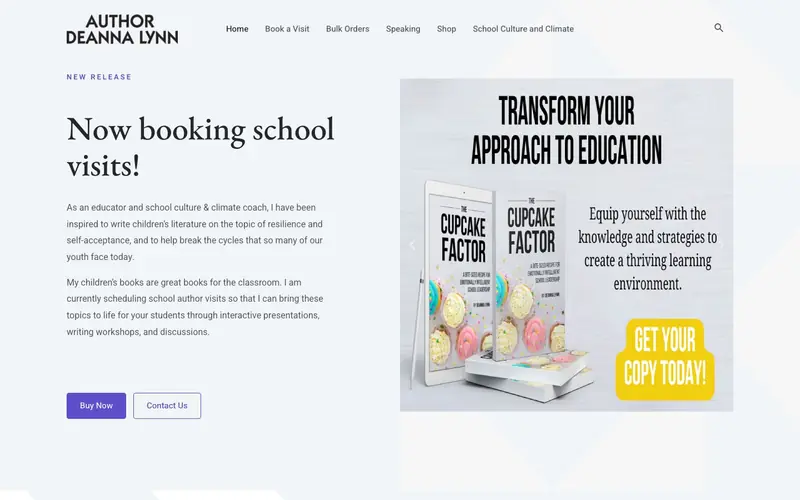 Author Deanna Lynn authordeannalynnbooks.com
-
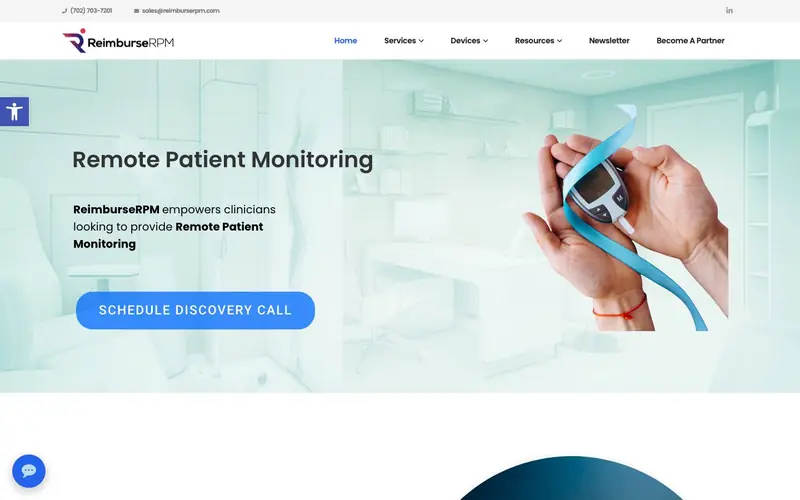 ReimburseRPM reimburserpm.com
-
 Artanic Shutters artanicshutters.co.uk
Screenshots are of each site's home page at the time of publishing. We have built more than 70 websites since 2011; some older sites are no longer online and are not shown.
Our own work, in the open
The Intelligence Lab is part of our work
We run the same methods on our own site and publish what we find: real search data, original research and free tools you can use today.
Intelligence Lab
Our live experiments and benchmarks, including the Search Console data from rebuilding this site.
Research and papers
Original white papers on search visibility and how AI assistants choose which businesses to recommend.
Free tools
Check how search and AI read your site, estimate automation ROI and test your team's AI readiness.
How we work with clients
Start with the commercial goal
Before any keyword or campaign, we agree what the business needs: more qualified enquiries, a better-informed sales team, a stronger position in a regulated market.
Measure what the business feels
Clicks and impressions matter only as far as they lead to enquiries and revenue. We report against the outcome, not the activity.
Say what we can prove
No ranking guarantees, no invented scores and no results we cannot document. Case studies are published once outcomes are verified and approved.
Want results you can trace to the business?
Tell us what you need to achieve. We will suggest a practical first step and how we would measure it.