
Intelligence Lab

Data, told as decisions.

How we collect, clean and tell stories with data. Three stories are real. Ten studio samples show what a study could look like before you commission one: seven on synthetic data, three on real public or our own data. Every chart says which it is.

See the data stories Or use the free tools →

  • 3real data stories
  • 10studio samples
  • 0invented client results

Real data Verified figures from our own sites or published research, with the source under every chart.

Method sample Synthetic data built to show the method. No client, no real result, nothing to quote.

Real data · our own site01

What twelve months of our own search data told us

We ran our own Search Console data through the method we use for clients. It was not flattering, which is why we publish it.

−82%monthly search impressions, November 2025 to October 2026

3.9% → 31.6%top-ten share of impressions, then of clicks

204,827 : 10impressions to clicks on our services page

Read the white paper

Search impressions per month, 1stcontent.co
Nov: 37 clicks, 63,375 impressionsDec: 27 clicks, 65,402 impressionsJan: 31 clicks, 65,119 impressionsFeb: 37 clicks, 51,350 impressionsMar: 34 clicks, 35,806 impressionsApr: 21 clicks, 30,532 impressionsMay: 9 clicks, 25,909 impressionsJun: 11 clicks, 28,203 impressionsJul: 11 clicks, 23,689 impressionsAug: 11 clicks, 23,935 impressionsSep: 12 clicks, 8,951 impressionsOct: 8 clicks, 11,285 impressionsNovDecJanFebMarAprMayJunJulAugSepOct63,375 impressions11,285Orange bars: clicks per month (own scale): 37 in Nov 2025, 8 in Oct 2026
Where impressions and clicks sat, by average position
ImpressionsTop 10: 3.9%Page 2: 10.8%10.8%Position 20+: 85.3%85.3%ClicksTop 10: 31.6%31.6%Page 2: 17.1%17.1%Position 20+: 51.3%51.3%Top 10Page 2 (10 to 20)Position 20 and below

Source: Google Search Console export for 1stcontent.co, 12 months to 4 November 2026. Shares are of the top 1,000 queries.
Real data · published by Caban02

Four trackers, four totals: turning African growth-capital data into a decision brief

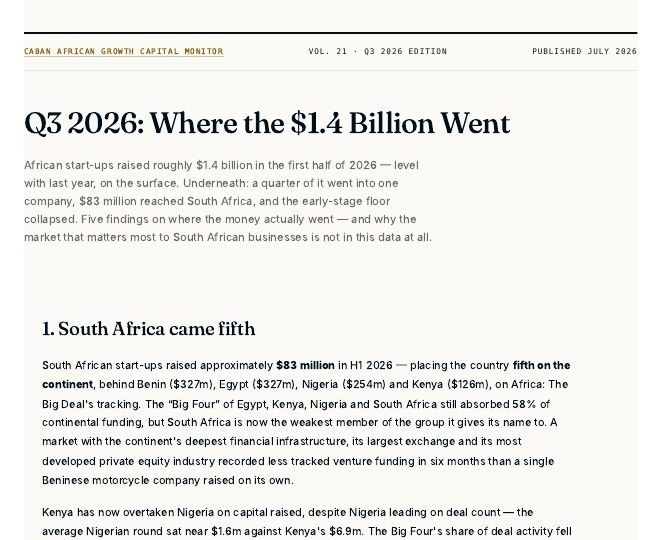
Caban Corporate Advisors publishes the African Growth Capital Monitor. Its Q3 2026 edition reconciles trackers that disagree and asks what the data means for founders, investors and sellers.

24%spread between four credible trackers on the same half-year

$83mSouth Africa, fifth in H1 2026

−44%rounds of $100k to $1m, 179 down to 100

Read the Monitor at caban.co.za

Opening page of the Caban African Growth Capital Monitor, Q3 2026
Four trackers, four totals for H1 2026
$1.2bn$1.3bn$1.4bn$1.5bnLaunch Base Africa: $1.21bnLaunch Base Africa$1.21bnAfrica: The Big Deal: $1.40bnAfrica: The Big Deal$1.40bnTechCabal: $1.44bnTechCabal$1.44bnCondia: $1.50bnCondia$1.50bn24% spread on one half-year
African start-up funding by market, H1 2026
BeninBenin: $327m$327mEgyptEgypt: $327m$327mNigeriaNigeria: $254m$254mKenyaKenya: $126m$126mSouth AfricaSouth Africa: $83m$83m

Source: Caban African Growth Capital Monitor, Vol. 21, Q3 2026 (published July 2026), citing Africa: The Big Deal, Launch Base Africa, TechCabal Insights and Condia. Figures are as reported at the time and are restated by trackers as deals are disclosed. Volumes 1 to 19 were compiled retrospectively in July 2026; the Monitor has published quarterly since Vol. 20.

Real data · published by TBL Accounting03

From tax notices to dated decisions: the Cash & Tax Brief

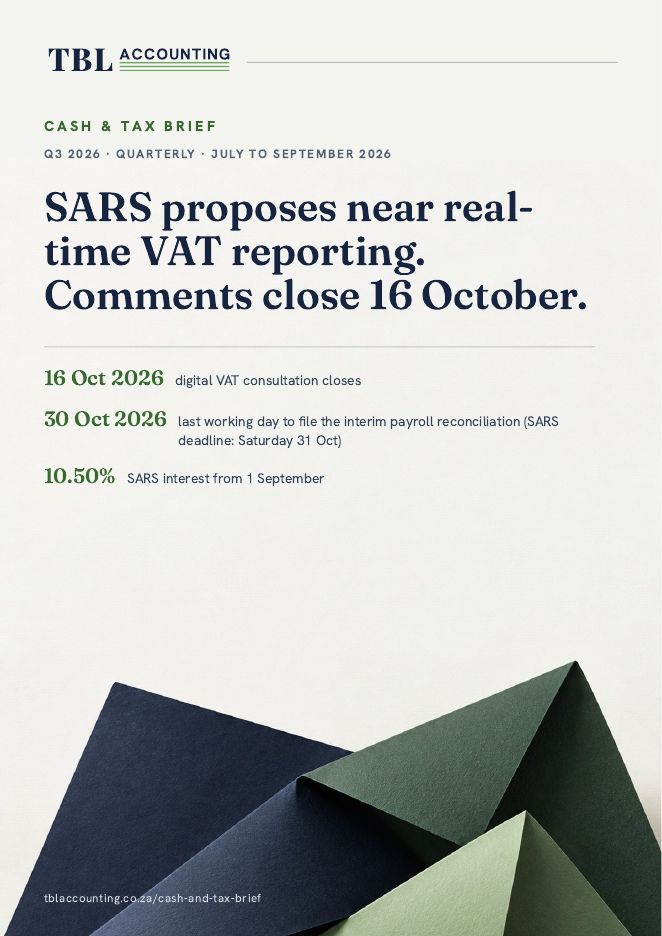
TBL Accounting publishes a quarterly Cash & Tax Brief that tracks SARS, CIPC, Treasury and HMRC changes and turns each into what changed, what it means and what to do, with dates and sources.

1% → 10%late interim EMP501 penalty, rising 1% of annual PAYE for each month outstanding

10.25% → 10.50%SARS interest on tax owed from 1 September 2026

4 datesflagged between October 2026 and January 2027

Read the Brief at tblaccounting.co.za

Cover of the TBL Accounting Cash and Tax Brief, Q3 2026
Late interim EMP501 penalty, % of annual PAYE, by months outstanding
1 months outstanding: 1% of annual PAYE11%2 months outstanding: 2% of annual PAYE22%3 months outstanding: 3% of annual PAYE33%4 months outstanding: 4% of annual PAYE44%5 months outstanding: 5% of annual PAYE55%6 months outstanding: 6% of annual PAYE66%7 months outstanding: 7% of annual PAYE77%8 months outstanding: 8% of annual PAYE88%9 months outstanding: 9% of annual PAYE99%10 months outstanding: 10% of annual PAYE1010%Months the interim EMP501 return stays outstanding
Dates the Q3 2026 edition flagged
OctNovDecJan16 OctDigital VATconsultation closes28 OctUK Budget30 OctInterim payroll reconciliation,last working day22 JanTrust filing season andauto-assessment pushback close

Source: TBL Accounting, Cash & Tax Brief, Q3 2026 (July to September 2026), citing SARS notices and HM Treasury. Penalty, rate and date figures are as stated in that edition.

Studio samples

If we were doing this study for you, here is part of what it could look like.

Think of these as designs in a shop window. Each shows the method, the chart form and the question a real study would answer. Seven use synthetic data and three use real public or our own data, and each is labelled. None is a client result, and none names a company.

Method sample04

Customer segmentation

What could 6 behavioural segments look like for a national retailer?

What it shows. Segments plotted by purchase frequency and basket value, sized by customer count, so we can see which groups deserve different messages.

What a real study needs. Customer-level transaction data, a loyalty or CRM identifier and a rule for activity windows.

Synthetic data for illustration. Not a client result.

Purchase frequency →Average basket value →Loyal high spendersLoyalBargain huntersBargain huntersOccasional basketOccasional basketLapsing regularsLapsingNew and curiousNewPayday shoppersPayday

Method sample05

Attribution and media mix

How would an attribution review change a budget split?

What it shows. A last-click view against an attribution-guided view that credits email, WhatsApp and in-store media. A real study would also model month-end pay cycles. The shape of a reallocation, not a promised result.

What a real study needs. Channel spend, conversion paths across online and in-store sales, and pay-cycle timing from your own sales data.

Synthetic data for illustration. Not a client result.

Last-click viewAttribution-guided viewPaid search 34%28% Paid searchPaid social 30%18% Paid socialEmail and WhatsApp 8%22% Email and WhatsAppIn-store media 20%24% In-store mediaAffiliates 8%8% Affiliates

Method sample06

Churn and retention

Where do customers leave, and which groups leave first?

What it shows. Retention curves for three segments. Steep early curves point to onboarding or price problems; flat ones point to loyalty. We would add real ICASA subscriber figures for market context once checked against the primary source.

What a real study needs. Subscription start and end dates, monthly usage and a clear churn definition.

Synthetic data for illustration. Not a client result.

Prepaid, low usage32%Month 0Month 12Contract, mid usage66%Month 0Month 12Contract, high usage90%Month 0Month 12

Method sample07

Omnichannel journeys

Where do customers drop off across WhatsApp, app, web and store?

What it shows. The same five-step journey on four channels, drawn as ribbons that narrow where customers leak out.

What a real study needs. Event data from each channel, a common customer ID and consistent stage definitions.

Synthetic data for illustration. Not a client result.

AwareBrowseBasketCheckoutPaidWhatsAppWhatsApp24%AppApp17%WebWeb9%StoreStore50%

Method sample08

Loyalty and cross-sell

Which loyalty members are ready for which category?

What it shows. A propensity heatmap of member segments against categories. Dark cells are where a personalised offer is most likely to fit, so offers are not sent to everyone.

What a real study needs. Member-level purchase history across categories, offer history and a consent record.

Synthetic data for illustration. Not a client result.

GroceriesHouseholdHealthBankingFuelCore shoppersCore shoppers · Groceries: propensity 9090Core shoppers · Household: propensity 6060Core shoppers · Health: propensity 4040Core shoppers · Banking: propensity 3030Core shoppers · Fuel: propensity 5050LapsingLapsing · Groceries: propensity 5050Lapsing · Household: propensity 3030Lapsing · Health: propensity 2020Lapsing · Banking: propensity 1010Lapsing · Fuel: propensity 2020New membersNew members · Groceries: propensity 4040New members · Household: propensity 3030New members · Health: propensity 5050New members · Banking: propensity 2020New members · Fuel: propensity 1010Bargain-ledBargain-led · Groceries: propensity 8080Bargain-led · Household: propensity 7070Bargain-led · Health: propensity 2020Bargain-led · Banking: propensity 1010Bargain-led · Fuel: propensity 3030

Method sample09

Customer lifetime value

How concentrated is customer value?

What it shows. A cumulative value curve. The steeper it rises, the more a few customers matter to the budget.

What a real study needs. Customer-level revenue and margin over a long enough window, and an agreed horizon.

Synthetic data for illustration. Not a client result.

Top 20% of customers = 55% of valueCustomers, ranked by value →

Real data sample10

Demand and promotion timing

When does South African retail demand actually peak?

What it shows. Monthly retail sales in 2024, indexed to the average month. December sat 38% above average and 55% above January; November sat 16% above. A promotion calendar should be read against this curve before dates are fixed.

What a real study needs. Your weekly sales by product and region, your promotion calendar and stock data.

Source: Stats SA, Retail trade sales release (P6242.1), October 2025, Table 1, unadjusted sales at constant 2019 prices. Index: monthly sales divided by the 2024 monthly average.

Jan 2024: 89 (average month = 100)JanFeb 2024: 92 (average month = 100)FebMar 2024: 98 (average month = 100)MarApr 2024: 92 (average month = 100)AprMay 2024: 97 (average month = 100)MayJun 2024: 96 (average month = 100)JunJul 2024: 93 (average month = 100)JulAug 2024: 96 (average month = 100)AugSep 2024: 95 (average month = 100)SepOct 2024: 97 (average month = 100)OctNov 2024: 116 (average month = 100)Nov116Dec 2024: 138 (average month = 100)Dec138Averagemonth = 100

Real data sample11

Cultural and behavioural audiences

Which languages do South Africans speak at home?

What it shows. One square is one percent of South Africans. English was the home language of 8.7%, while isiZulu and isiXhosa together were 40.7%. Home language is not the same as language understood, so a real study would add media and survey data before changing creative.

What a real study needs. Your response data by region, language and creative version, and a test design.

Source: Stats SA, Census 2022, as reported by BusinessTech (10 October 2023). Shares are rounded; to be checked against the Stats SA primary release.

isiZuluisiZuluisiZuluisiZuluisiZuluisiZuluisiZuluisiZuluisiZuluisiZuluisiZuluisiZuluisiZuluisiZuluisiZuluisiZuluisiZuluisiZuluisiZuluisiZuluisiZuluisiZuluisiZuluisiZuluisiXhosaisiXhosaisiXhosaisiXhosaisiXhosaisiXhosaisiXhosaisiXhosaisiXhosaisiXhosaisiXhosaisiXhosaisiXhosaisiXhosaisiXhosaisiXhosaAfrikaansAfrikaansAfrikaansAfrikaansAfrikaansAfrikaansAfrikaansAfrikaansAfrikaansAfrikaansAfrikaansSepediSepediSepediSepediSepediSepediSepediSepediSepediSepediEnglishEnglishEnglishEnglishEnglishEnglishEnglishEnglishEnglishSetswanaSetswanaSetswanaSetswanaSetswanaSetswanaSetswanaSetswanaSesothoSesothoSesothoSesothoSesothoSesothoSesothoSesothoOther languagesOther languagesOther languagesOther languagesOther languagesOther languagesOther languagesOther languagesOther languagesOther languagesOther languagesOther languagesOther languagesOther languagesisiZulu24.4%isiXhosa16.3%Afrikaans10.6%Sepedi10.0%English8.7%Setswana8.3%Sesotho7.8%Other languages13.9%

Real data sample12

Vanity metrics versus outcomes

Did visibility and clicks move together?

What it shows. Our own impressions and clicks fell together, and the click rate stayed near 0.06 to 0.07%, so more impressions alone would not have meant more enquiries. Visibility is a vanity metric until it is tied to enquiries.

What a real study needs. Search Console data plus enquiry records by source, so clicks can be followed to outcomes.

Source: Google Search Console export for 1stcontent.co, 12 months to 4 November 2026: 434,086 impressions, 253 clicks.

Impressions63,375 → 11,285Clicks37 → 8NovDecJanFebMarAprMayJunJulAugSepOct

Method sample13

Sentiment and share of voice

What does a swing in sentiment look like, week by week?

What it shows. Weekly net sentiment for one brand with the events that moved it: an outage, an apology, a fix. The team sees which action shifted the signal. Real public search-interest data can be layered in later.

What a real study needs. Social, review and support data for your brand and competitors, with agreed classification rules.

Synthetic data for illustration. Not a client result.

Service outagePublic apologyFix shippedW1W4W7W10W12Net sentiment, one brand, weekly (synthetic events). Above the line is positive, below is negative.

Your study

Have a question these samples do not cover?

Tell us the decision you need to make. We will say which data would answer it, what the analysis would show and what it would cost, before you commit to anything.

Talk to us about a data study